매우매우 지겨운 과정이고 특별한 것이 없기 때문에 코드만 남겨둔다.
1. main 파일
# main.py 파일
from fastapi import FastAPI
from fastapi.middleware.cors import CORSMiddleware
from routers import user, population, maritalstatus, bmi_status, religion, smoking, drinking, parent_asset, academic_background, income

app = FastAPI()

app.include_router(user.router)
app.include_router(population.router)
app.include_router(maritalstatus.router)
app.include_router(bmi_status.router)
app.include_router(religion.router)
app.include_router(smoking.router)
app.include_router(drinking.router)
app.include_router(parent_asset.router)
app.include_router(academic_background.router)
app.include_router(income.router)

origins = [
    "http://localhost:3000",
    "http://localhost:8000",
    "http://localhost:8000/maritalstatus",
    "http://localhost:8000/bmistatus",
    "http://localhost:8000/religion",
    "http://localhost:8000/smoking",
    "http://localhost:8000/drinking",
    "http://localhost:8000/parent_asset",
    "http://localhost:8000/academic_background",
    "http://localhost:8000/income",
]

app.add_middleware(
    CORSMiddleware,
    allow_origins=origins,
    allow_methods=["GET", "POST", "PUT", "DELETE"],  # 수정된 부분: 모든 HTTP 메서드를 허용합니다.
    allow_headers=["*"],
)

@app.get('/')
def root():
    return "hello world"
라우터 임포트하고 cors 문제를 해결했다.
2. 라우터 추가
# routers 폴더 - religion_status.py
from fastapi import APIRouter, Depends, HTTPException
from sqlalchemy.orm import Session
from routers.schemas import ReligionBase, ReligionDisplay
from db.database import get_db
from db import db_religion_crud

router = APIRouter(
    prefix='/religion',
    tags=['religion']
)


@router.post('', response_model=ReligionDisplay)
def religion_question(request: ReligionBase, db: Session = Depends(get_db)):
    # 유효성 검사: 성별이 제공되었는지 확인
    if request.gender == "남" or "남자":
        request.gender = "남자"
    elif request.gender == "여" or "여자":
        request.gender = "여자"
    else:
        raise HTTPException(status_code=400, detail="Gender is required")

    # 유효성 검사: 시작 나이가 종료 나이보다 큰지 확인
    if request.age_start and request.age_end and request.age_start > request.age_end:
        request.age_start, request.age_end = request.age_end, request.age_start


    if request.location:
        for index, location in enumerate(request.location):
            if location == '강원특별자치도':
                request.location[index] = '강원도'

    # 데이터베이스 조회
    return db_religion_crud.religion_ans(db, request)
입력 받은 데이터 중에 지역명의 조금 달라져서 예외를 추가했다.
# routers 폴더 - smoking.py
from fastapi import APIRouter, Depends, HTTPException
from sqlalchemy.orm import Session
from routers.schemas import SmokingBase, SmokingDisplay
from db.database import get_db
from db import db_smoking_crud

router = APIRouter(
    prefix='/smoking',
    tags=['smoking']
)

@router.post('', response_model=SmokingDisplay)
def smoking_question(request: SmokingBase, db: Session = Depends(get_db)):
    # 유효성 검사: 성별이 제공되었는지 확인
    if request.gender not in ["남", "남자", "여", "여자"]:
        raise HTTPException(status_code=400, detail="Gender is required and should be '남', '남자', '여', or '여자'")

    # 성별 값 표준화
    if request.gender in ["남", "남자"]:
        request.gender = "남자"
    elif request.gender in ["여", "여자"]:
        request.gender = "여자"

    # 유효성 검사: 시작 나이가 종료 나이보다 큰지 확인
    if request.age_start is not None and request.age_end is not None and request.age_start > request.age_end:
        request.age_start, request.age_end = request.age_end, request.age_start

    if request.smoking == "상관없음":
        return SmokingDisplay(smoking_rate=100)
    else:
        return db_smoking_crud.smoking_ans(db, request)
흡연 관련 데이터를 출입구. 어쩌다 보니 예외처리가 들어갔다. 나중에 한번에 처리할려고 했는데 포함되었다.
# routers 폴더 - drinking.py
from fastapi import APIRouter, Depends, HTTPException
from sqlalchemy.orm import Session
from routers.schemas import DrinkingBase, DrinkingDisplay
from db.database import get_db
from db import db_drinking_crud

router = APIRouter(
    prefix='/drinking',
    tags=['drinking']
)

@router.post('', response_model=DrinkingDisplay)
def drinking_question(request: DrinkingBase, db: Session = Depends(get_db)):
    # 유효성 검사: 성별이 제공되었는지 확인
    if request.gender not in ["남", "남자", "여", "여자"]:
        raise HTTPException(status_code=400, detail="Gender is required and should be '남', '남자', '여', or '여자'")

    # 성별 값 표준화
    if request.gender in ["남", "남자"]:
        request.gender = "남자"
    elif request.gender in ["여", "여자"]:
        request.gender = "여자"

    # 유효성 검사: 시작 나이가 종료 나이보다 큰지 확인
    if request.age_start is not None and request.age_end is not None and request.age_start > request.age_end:
        request.age_start, request.age_end = request.age_end, request.age_start

    if request.drinking:
        if len(request.drinking) == 6:
            return DrinkingDisplay(drinking_rate = 100)
        return db_drinking_crud.drinking_ans(db, request)
음주 관련 데이터 출입구. 흡연 라우터와 비슷하다.
# routers 폴더 - paent_asset.py
from fastapi import APIRouter, Depends, HTTPException
from routers.schemas import ParentAssetDisplay, ParentBase

router = APIRouter(
    prefix='/parent_asset',
    tags=['parent_asset']
)

@router.post('', response_model=ParentAssetDisplay)
def parent_asset(request: ParentBase):
    # 유효성 검사: 성별이 제공되었는지 확인
    if not request.parent_rate:
        raise HTTPException(status_code=400, detail=f"값 없음, {request.parent_rate}")

    asset_ans_dict = {
        '상관없음' : 1,
        '3.15억 이상': 0.5,
        '4.35억 이상': 0.4,
        '6.00억 이상': 0.3,
        '8.30억 이상': 0.2,
        '12.85억 이상': 0.1,
        '18.30억 이상': 0.05,
        '35.75억 이상': 0.01,
        '48.05억 이상': 0.005,
        '75.50억 이상': 0.001,
    }
    asset_ans = ParentAssetDisplay(
        parent_rate = asset_ans_dict[request.parent_rate]
        )

    return asset_ans
부모님 자산 관련 데이터 출입구.
데이터가 몇개 없고 파일을 구하기 어려워서 참고할만한 기사를 가지고 하드코딩했다. 사실 DB에 넣고 CRUD하는게 귀찮았다.
# routers 폴더 - academic_background.py
from fastapi import APIRouter, Depends, HTTPException
from routers.schemas import AcademicBackgroundBase, AcademicBackgroundDisplay

router = APIRouter(
    prefix='/academic_background',
    tags=['academic_background']
)

@router.post('', response_model=AcademicBackgroundDisplay)
def parent_asset(request: AcademicBackgroundBase):
    # 유효성 검사: 성별이 제공되었는지 확인
    if not request.academic_background:
        raise HTTPException(status_code=400, detail=f"값 없음, {request.academic_background}")

    academic_background_ans_dict = {
        '상관없음' : 0,
        '중졸 이상': 100 - (16.4 + 47.1 + 17.4 + 14.8),
        '고졸 이상' : 100 - (47.1 + 17.4 + 14.8),
        '2~3년제 대학교 이상' : 100 - (17.4 + 14.8),
        '4년제 대학교 이상': 100 - (14.8),
        '1등급 이상': 4,
        '2등급 이상': 11,
        '3등급 이상': 23,
        '4등급 이상': 40,
        '5등급 이상': 60,
        '6등급 이상': 77,
        '7등급 이상': 89,
        '8등급 이상': 96,
    }
    academic_background_ans = AcademicBackgroundDisplay(
        academic_background_rate = academic_background_ans_dict[request.academic_background]
        )

    return academic_background_ans
배우자 학력 수준. 역시 몇개 없어서 하드코딩이다.
프론트엔드에 100-확률 계산하기 때문에 수식이 약간 일관성이 없다.
from fastapi import APIRouter, Depends, HTTPException
from sqlalchemy.orm import Session
from routers.schemas import IncomeBase, IncomeDisplay
from db.database import get_db
from db import db_income_crud

router = APIRouter(
    prefix='/income',
    tags=['income']
)

@router.post('', response_model=IncomeDisplay)
def smoking_question(request: IncomeBase, db: Session = Depends(get_db)):
    # 요청된 나이 범위의 유효성 검사
    if request.age_start is not None and request.age_end is not None and request.age_start > request.age_end:
        request.age_start, request.age_end = request.age_end, request.age_start

    # 소득 항목 리스트 설정
    income_list = set(["1000만원 이상",
                       "150~250만원",
                       "250~350만원",
                       "350~450만원",
                       "450~550만원",
                       "550~650만원",
                       "650~800만원",
                       "800~1000만원",
                       "85만원 미만",
                       "85~150만원",
                       "상관없음"])

    # 요청된 소득 항목 집합 설정
    request_set = set(request.income)

    # 소득 항목이 유효한지 확인
    if not request_set.issubset(income_list):
        raise HTTPException(status_code=400, detail="잘못된 소득 항목입니다.")

    # '상관없음'인 경우 소득 비율을 100으로 설정
    if "상관없음" in request.income:
        return IncomeDisplay(income_rate=100.0)
    else:
        return db_income_crud.income_ans(db, request)
배우자 소득 수준 라우터이다. 입력값 검증을 좀 확실하게 해두었다.
3. 스키마
# routers 폴더 - schemas.py
from pydantic import BaseModel
from datetime import datetime
from pydantic import Field
from typing import Union, Dict
class UserBase(BaseModel):
username: str
password: str
# todo 암호관련 작업 필요하다.
class UserDisplay(BaseModel):
username: str
class Config():
from_attributes = True
class CommentBase(BaseModel):
text: str
username: str
timestamp: datetime
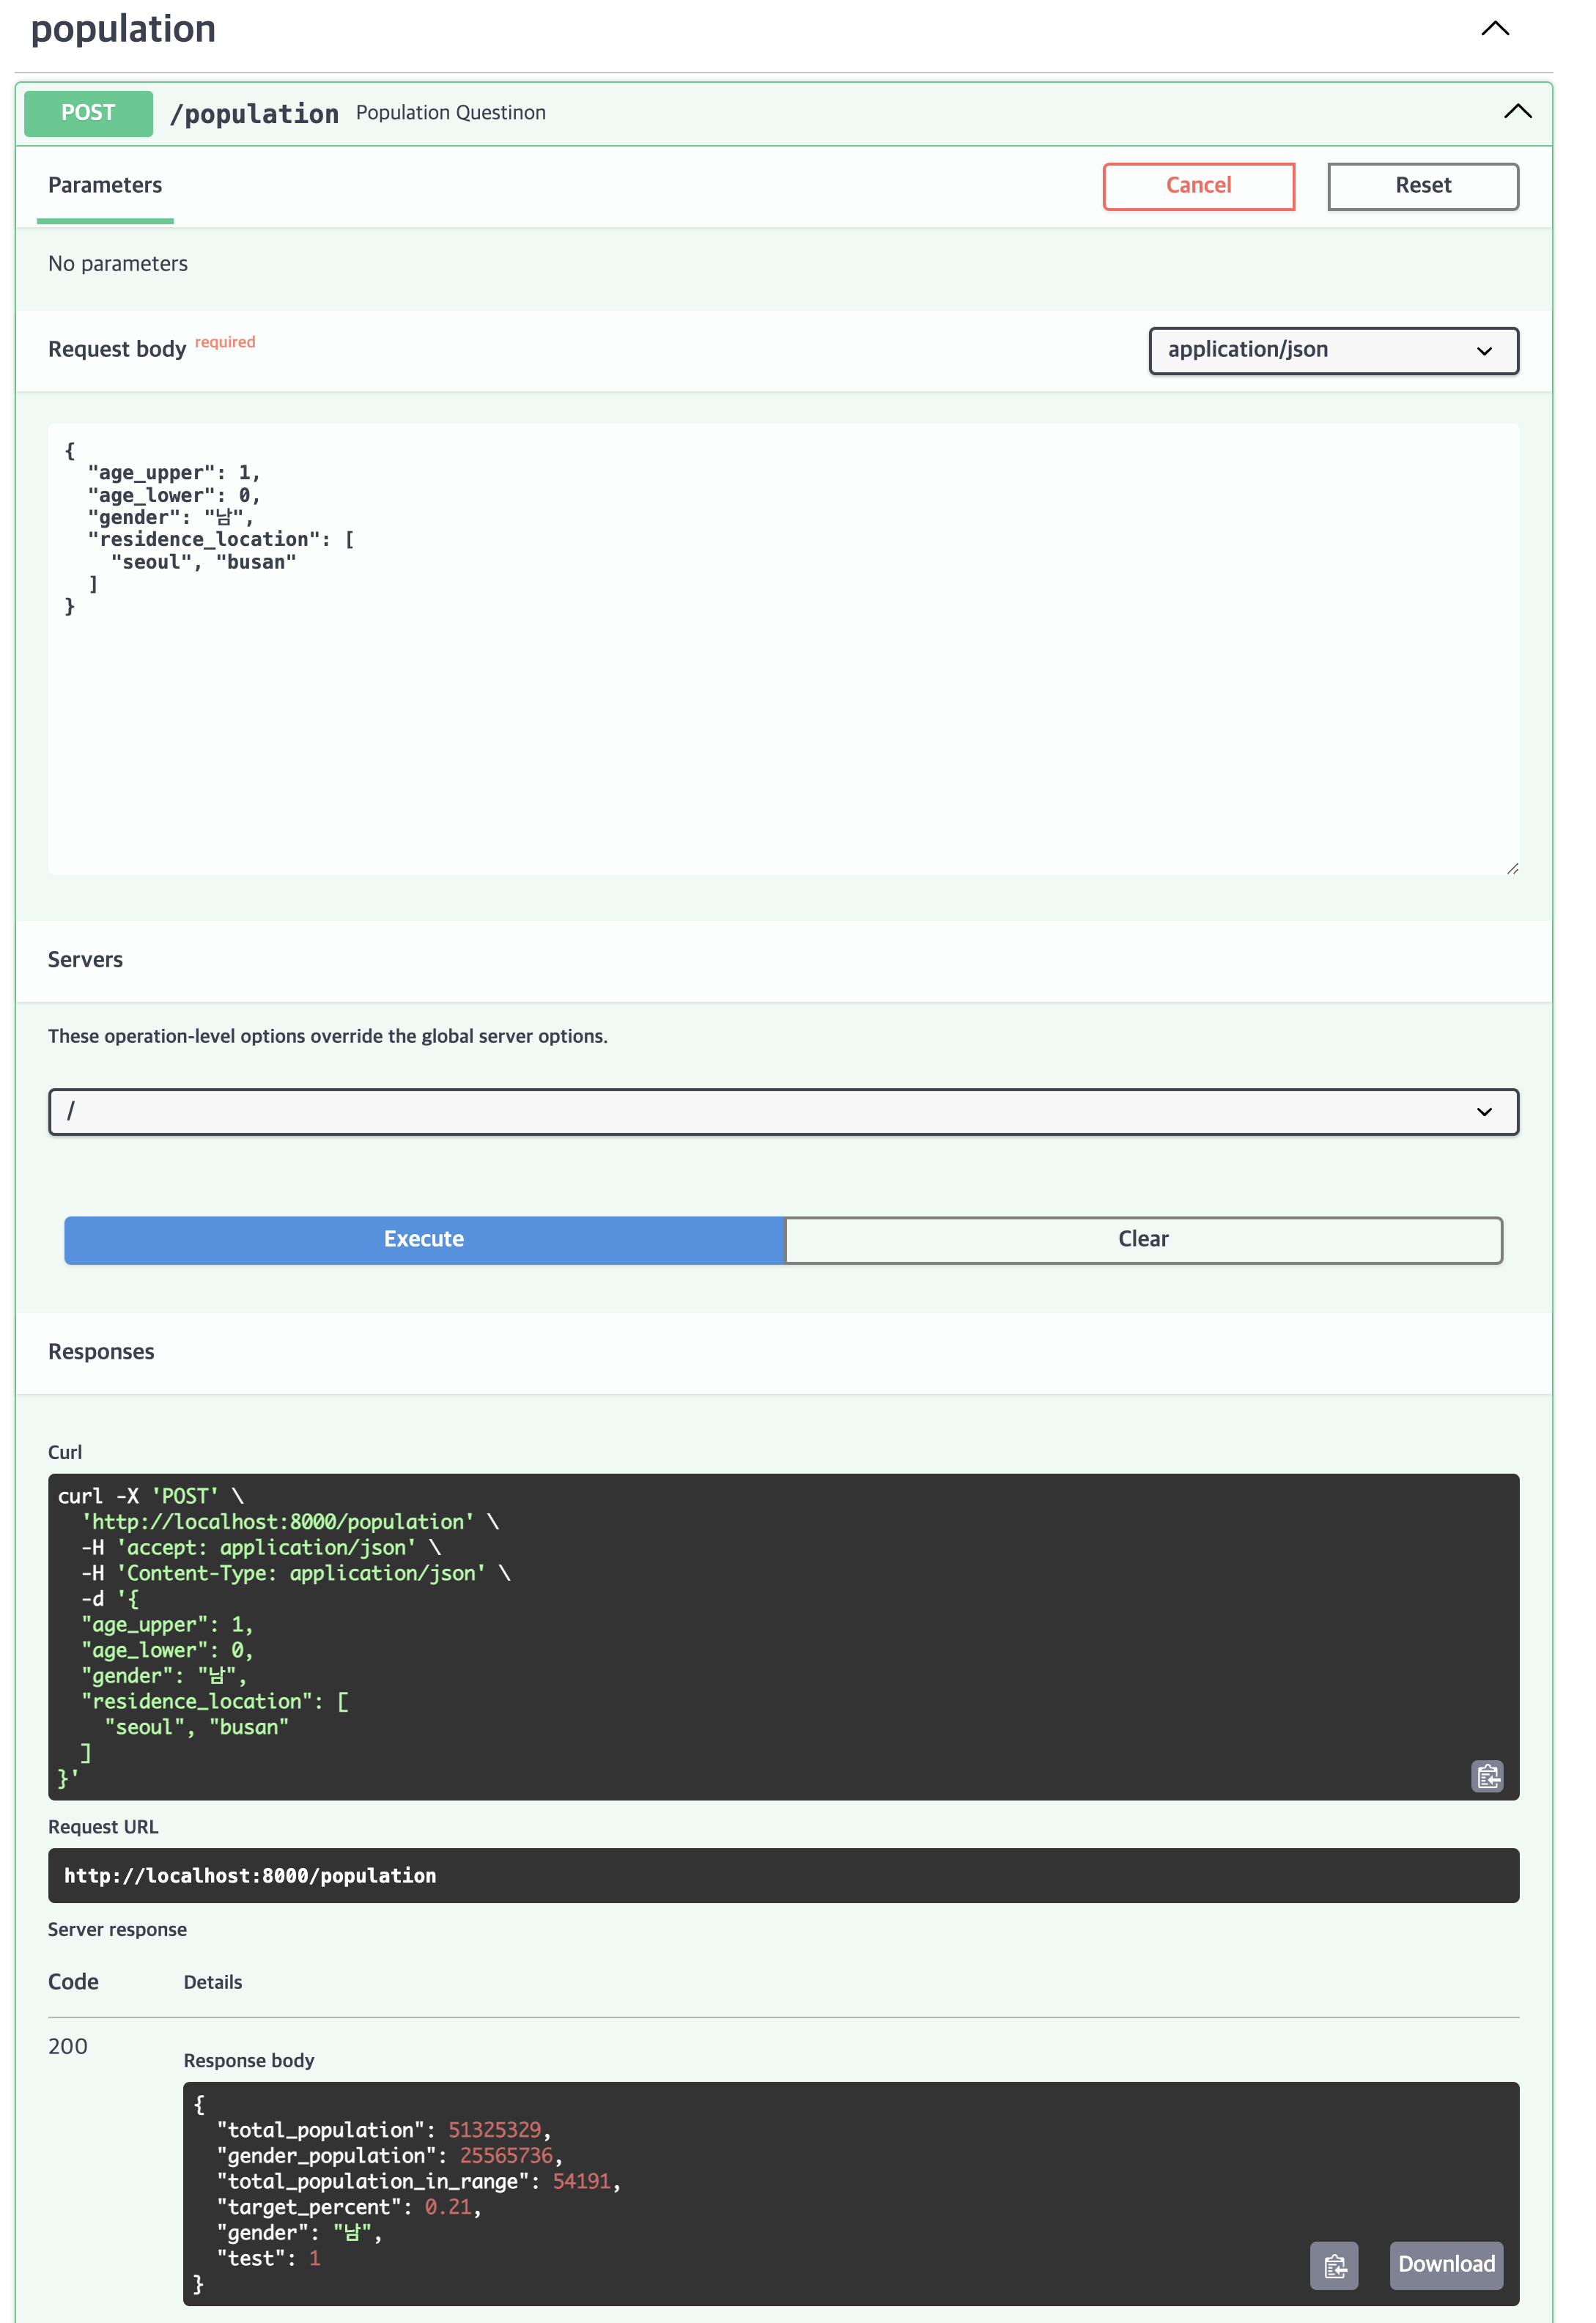
class PopulationQuestion(BaseModel):
gender: str | None = '남'
age_start: int | None = None
age_end: int | None = None
location: list | None = None
class PopulationDisplay(BaseModel):
gender: str | None = None
man_gender_population: int | None = None
woman_gender_population: int | None = None
total_population: int | None = None
man_age_range_population: int | None = None
woman_age_range_population: int | None = None
total_population_in_range: int | None = None
man_population_by_region: int | None = None
woman_population_by_region: int | None = None
man_population_by_all_region: Dict[str, int] | None = None # 수정된 부분
woman_population_by_all_region: Dict[str, int] | None = None # 수정된 부분
class MaritalStatusBase(BaseModel):
maritalstatus: list
gender: str | None = None
age_start: int | None = None
age_end: int | None = None
location: list | None = None
class MaritalStatusDisplay(BaseModel):
age_start : int | None = None
age_end : int | None = None
total_pop_marital : int | None = None
target_pop_marital : int | None = None
class BmiStatusBase(BaseModel):
bmistatus: list
gender: str
age_start: int
age_end: int
class BmiStatusDisplay(BaseModel):
total_pop_bmi : int | None = None
target_pop_bmi : int | None = None
class ReligionBase(BaseModel):
religion : list
gender: str
age_start: int
age_end: int
location: list
class ReligionDisplay(BaseModel):
whole_country_pop_religion : int | None = None
whole_country_pop_selected_religion : int | None = None
selected_location_religion_sum : int | None = None
selected_location_religion_target_sum : int | None = None
class SmokingBase(BaseModel):
smoking: str
gender: str
age_start: int
age_end: int
class SmokingDisplay(BaseModel):
smoking_rate : float | None = None
class DrinkingBase(BaseModel):
drinking: list
gender: str
age_start: int
age_end: int
class DrinkingDisplay(BaseModel):
drinking_rate : float | None = None
class ParentBase(BaseModel):
parent_rate : str | None = None
class ParentAssetDisplay(BaseModel):
parent_rate : float | None = None
class AcademicBackgroundBase(BaseModel):
academic_background : str | None = None
class AcademicBackgroundDisplay(BaseModel):
academic_background_rate : float | None = None
class IncomeBase(BaseModel):
income: list
age_start: int
age_end: int
class IncomeDisplay(BaseModel):
income_rate : float | None = None
# class PopulationDisplay(BaseModel):
# gender: str
# total_population : int
# man_population: int
# woman_gender_population: int
# total_population_in_range : int
# man_age_range_population: int
# woman_age_range_population: int
# man_population_by_rigion = Dict[str, int]
# woman_population_by_rigion = Dict[str, int]
# class Config():
# from_attributes = True
# # todo 그래프를 그릴 데이터를 같이 반환할 필요가 있겠다.
# class PostBase(PopulationQuestion):
# height_upper: str | None = None
# height_lower: str | None = None
# marriage: str | None = None
# bmi: str | None = None
# personality: str | None = None
# education: str | None = None
# religion: str | None = None
# smoking: str | None = None
# drinking: str | None = None
# occupation: str | None = None
# parent_asset: str | None = None
# timestamp: datetime
스키마도 입출력 형식에 맞게 짜두었다.
4. db모델
# models.py
from db.database import Base
from sqlalchemy import Column, Integer, String, DateTime, ForeignKey, Float
from sqlalchemy.orm import relationship
class DbUser(Base):
__tablename__= 'user'
id = Column(Integer, primary_key=True, index=True)
username = Column(String)
password = Column(String)
items = relationship('DbPost', back_populates='user')
# todo 암호 관련 작업이 필요하다.
class DbPost(Base):
__tablename__ = 'post'
id = Column(Integer, primary_key=True, index=True)
age = Column(String)
height = Column(String)
education = Column(String)
occupation = Column(String)
residence_location = Column(String)
religion = Column(String)
timestamp = Column(DateTime)
user_id = Column(Integer, ForeignKey('user.id'))
user = relationship('DbUser', back_populates='items')
comments = relationship('DbComment', back_populates='post')
class DbComment(Base):
__tablename__ = 'comment'
id = Column(Integer, primary_key=True, index=True)
text = Column(String)
username = Column(String)
timestamp = Column(DateTime)
post_id = Column(Integer, ForeignKey('post.id'))
post = relationship('DbPost', back_populates='comments')
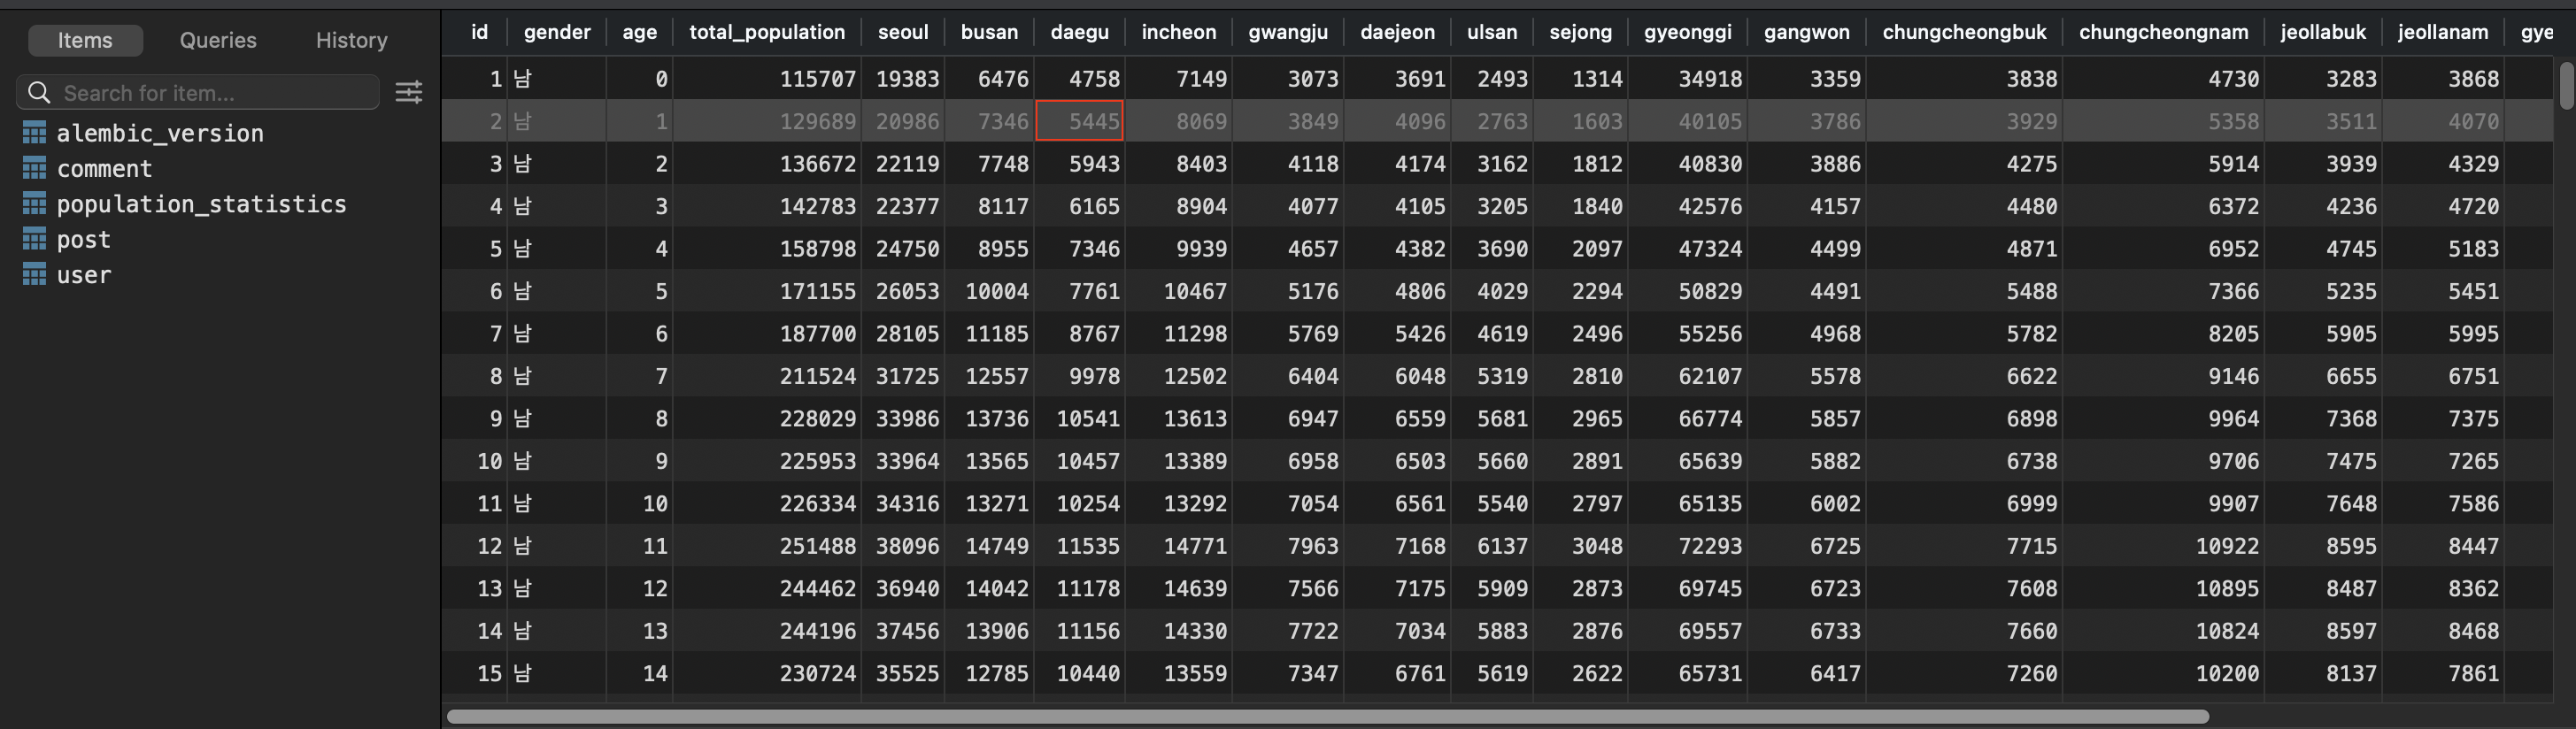
class DbPopulation(Base):
__tablename__ = 'population_statistics'
id = Column(Integer, primary_key=True, index=True)
gender = Column(String)
age = Column(Integer)
total_population = Column(Integer)
seoul = Column(Integer)
busan = Column(Integer)
daegu = Column(Integer)
incheon = Column(Integer)
gwangju = Column(Integer)
daejeon = Column(Integer)
ulsan = Column(Integer)
sejong = Column(Integer)
gyeonggi = Column(Integer)
gangwon = Column(Integer)
chungcheongbuk = Column(Integer)
chungcheongnam = Column(Integer)
jeollabuk = Column(Integer)
jeollanam = Column(Integer)
gyeongsangbuk = Column(Integer)
gyeongsangnam = Column(Integer)
jeju = Column(Integer)
class DbMaritalStatus(Base):
__tablename__ = 'marital_status_statistics'
id = Column(Integer, primary_key=True, index=True)
residential_area = Column(String)
age = Column(String)
man_age_total = Column(Integer)
man_unmarried = Column(Integer)
man_Married = Column(Integer)
man_Separation_by_death = Column(Integer)
man_divorce = Column(Integer)
woman_age_total = Column(Integer)
woman_unmarried = Column(Integer)
woman_Married = Column(Integer)
woman_Separation_by_death = Column(Integer)
woman_divorce = Column(Integer)
class DbBmiStatus(Base):
__tablename__ = 'bmi_status_statistics'
id = Column(Integer, primary_key=True, index=True)
age = Column(String)
gender = Column(String)
total = Column(Integer)
BMI_18_5_under = Column(Integer)
BMI_18_5to25_0 = Column(Integer)
BMI_25_0to30_0 = Column(Integer)
BMI_30_5to40_0 = Column(Integer)
BMI_40_0_over = Column(Integer)
class DbReligion(Base):
__tablename__ = 'Religon_statistics'
id = Column(Integer, primary_key=True, index=True)
residence_location = Column(String)
gender = Column(String)
age = Column(String)
total = Column(Integer)
christianity = Column(Integer)
catholicism = Column(Integer)
etc = Column(Integer)
daesoonjinrihoe = Column(Integer)
daejonggyo = Column(Integer)
buddhism = Column(Integer)
one_buddhism = Column(Integer)
confucianism = Column(Integer)
atheist = Column(Integer)
religious = Column(Integer)
chondogye = Column(Integer)
class DbSmoking(Base):
__tablename__ = 'smoking_statistics'
id = Column(Integer, primary_key=True, index=True)
gender = Column(String)
age = Column(String)
smoking_rate = Column(Float)
class DbDrinkingPerMonth(Base):
__tablename__ = 'drinking_per_month'
id = Column(Integer, primary_key=True, index=True)
gender = Column(String)
age = Column(String)
no_drinking = Column(Float)
drinking = Column(Float)
one_under_per_month = Column(Float)
one_two_per_month = Column(Float)
one_two_per_week = Column(Float)
three_fout_per_week = Column(Float)
everyday = Column(Float)
class DbIncome(Base):
__tablename__ = 'income'
id = Column(Integer, primary_key=True, index=True)
age = Column(String)
income_1000_over = Column(Float)
income_150_250 = Column(Float)
income_250_350 = Column(Float)
income_350_450 = Column(Float)
income_450_550 = Column(Float)
income_550_650 = Column(Float)
income_650_800 = Column(Float)
income_800_1000 = Column(Float)
income_85_under = Column(Float)
income_85_150 = Column(Float)
# alembic revision --autogenerate
# alembic upgrade head
# 잘못된 db 테이블을 생성했을때 사용
# alembic revision --autogenerate -m "Drop table 테이블이름"
# alembic upgrade head
db 모델도 특별할것은 없다. 다만 늦게 알게 된 부분이 있는데
db의 칼럼명은 영어로 하고 입력 받는 칼럼명은 한글일때 어떻게 일치 시킬지가 고민이었다.
예를 들어 'engligh' 와 '영어' 처럼 말이다. 한두개면 그냥 하드코딩하지만 몇십개가 되면 상당히 골치 아픈 부분이다.
이때 모델링을 할때 english = Column(str, name='영어') 으로 name 옵션을 붙여두면 데이터 처리할때 활용할수 있다.
이미 하드코딩을 한 상태라서 그냥 놔둬버렸다.
뭔가 불편하고 귀찮은 코딩 방식인데 라는 생각이 들면 100% 쉬운 방법이 있다는 것을 유념해야 한다.
실제로 시도해봤지만 잘안되서 역시 하드코딩을 ㅠㅜ
5. DB CRUD 파일
from sqlalchemy.orm.session import Session
from sqlalchemy import func, Integer
from db.models import DbReligion
from routers.schemas import ReligionBase, ReligionDisplay

def religion_ans(db: Session, request: ReligionBase):
    # 필터링된 결과를 가리킬 변수
    filtered_db = db.query(DbReligion)

    # 성별로 필터링
    filtered_db = filtered_db.filter(DbReligion.gender == request.gender)

    # 나이로 필터링
    min_age = request.age_start
    max_age = request.age_end
    filtered_db = filtered_db.filter(DbReligion.age.cast(Integer).between(min_age, max_age))

    # 지역으로 필터링
    if "전국" not in request.location:
        request.location.append("전국")
    filtered_db = filtered_db.filter(DbReligion.residence_location.in_(request.location))

    _selected_religion = []

    religion_dict = {
        '기타': 'etc',
        '개신교': 'christianity',
        '천주교': 'catholicism',
        '대순진리회': 'daesoonjinrihoe',
        '대종교': 'daejonggyo',
        '불교': 'buddhism',
        '원불교': 'one_buddhism',
        '유교': 'confucianism',
        '종교없음': 'atheist',
        '종교있음': 'religious',
        '천도교': 'chondogye'
    }
    for key in request.religion:
        _selected_religion.append(religion_dict[key])

    # DB 지역 칼럼 이름 가져오기
    religion_columns = [column.key for column in DbReligion.__table__.columns \
                      if column.key in _selected_religion]


    # 전국 + 전체 종교인구
    _whole_country_pop_religion = (
        filtered_db.filter(DbReligion.residence_location == '전국')
        .with_entities(func.sum(DbReligion.total))
        .scalar()
    )

    _whole_country_pop_selected_religion = 0
    _selected_location_religion_target_sum = 0

    for region in religion_columns:
        # 전국 + 선택한 종교 인구
        _whole_country_pop_selected_religion += (
            filtered_db.filter(DbReligion.residence_location == '전국')
            .with_entities(func.sum(getattr(DbReligion, region)))
            .scalar()
        )

        # 선택한 지역 + 선택한 종교 인구
        _selected_location_religion_target_sum += (
            filtered_db.filter(DbReligion.residence_location != '전국')
            .with_entities(func.sum(getattr(DbReligion, region)))
            .scalar()
        )

    # 선택한 지역 + 전체 종교 인구
    _selected_location_religion_sum = (
        filtered_db.filter(DbReligion.residence_location != '전국')
        .with_entities(func.sum(DbReligion.total))
        .scalar()
    )


    religion_result = ReligionDisplay(
        whole_country_pop_religion = _whole_country_pop_religion,
        whole_country_pop_selected_religion = _whole_country_pop_selected_religion,
        selected_location_religion_sum = _selected_location_religion_sum,
        selected_location_religion_target_sum=_selected_location_religion_target_sum
    )
    return religion_result
위에서 말한 하드코딩의 예시. 종교명을 딕셔너리로 다 적었다.
# db 폴더 - db_smoking_crud.py
from sqlalchemy.orm.session import Session
from sqlalchemy import func, or_, and_
from db.models import DbSmoking
from routers.schemas import SmokingBase,SmokingDisplay

def smoking_ans(db: Session, request: SmokingBase):
    filtered_db = db.query(DbSmoking)

    # 성별 필터링
    filtered_db = filtered_db.filter(DbSmoking.gender == request.gender)

    age_ranges = []

    dividing_value = 10

    # 19세 이하 처리
    age_start = request.age_start - request.age_start % dividing_value

    # 84세 이상 처리
    if request.age_end >= 70:
        age_ranges.append("70세이상")
        request.age_end = 61

    # 10세 단위로 범위 생성
    age_ranges.extend(
        [f"{i}-{i + dividing_value - 1}세" if i > 29 else "19-29세" for i in
         range(age_start, request.age_end + 1, dividing_value)])


    # 필터링을 위한 조건 생성
    filter_condition = or_(*[DbSmoking.age.like(f"{age_range}") for age_range in age_ranges])

    # 데이터베이스에서 필터링된 결과 가져오기
    filtered_data = filtered_db.filter(filter_condition).all()

    # 필터링 된 데이터의 갯수 가져오기
    count = len(filtered_data)

    # 흡연 비율 계산
    _smoking_rate = round(sum(data.smoking_rate for data in filtered_data) / count, 2)

    # 결과 반환
    if request.smoking == "비흡연":
        _smoking_rate = 100 - _smoking_rate

    smoking_result = SmokingDisplay(
        smoking_rate=_smoking_rate,
    )
    return smoking_result
흡연 CRUD. 나이 처리가 특이하다.
정수로 들어오는 나이를 19~29세라는 통계의 칼럼으로 바꿨다.
# db폴더 db_drinking_crud.py
from sqlalchemy.orm.session import Session
from sqlalchemy import func, or_, and_
from db.models import DbDrinkingPerMonth
from routers.schemas import DrinkingBase,DrinkingDisplay

def drinking_ans(db: Session, request: DrinkingBase):
    filtered_db = db.query(DbDrinkingPerMonth)

    # 성별 필터링
    filtered_db = filtered_db.filter(DbDrinkingPerMonth.gender == request.gender)

    age_ranges = []

    dividing_value = 10

    # 19세 이하 처리
    if request.age_start <= 19:
        request.age_start = 20
    request.age_start = request.age_start - request.age_start % dividing_value

    # 84세 이상 처리
    if request.age_end >= 60:
        age_ranges.append("60세이상")
        request.age_end = 59

    # 10세 단위로 범위 생성
    age_ranges.extend(
        [f"{i}~{i + dividing_value - 1}세" for i in range(request.age_start, request.age_end + 1, dividing_value)])

    # 필터링을 위한 조건 생성
    filter_condition = or_(*[DbDrinkingPerMonth.age.like(f"{age_range}") for age_range in age_ranges])

    # 데이터베이스에서 필터링된 결과 가져오기
    filtered_data = filtered_db.filter(filter_condition).all()

    # 필터링 된 데이터의 갯수 가져오기
    count = len(filtered_data)

    # 흡연 비율 계산
    _no_drinking = round(sum(data.no_drinking for data in filtered_data) / count, 2)
    _drinking = round(sum(data.drinking for data in filtered_data) / count, 2)
    _one_under_per_month = round(sum(data.one_under_per_month for data in filtered_data) / count, 2)
    _one_two_per_month = round(sum(data.one_two_per_month for data in filtered_data) / count, 2)
    _one_two_per_week = round(sum(data.one_two_per_week for data in filtered_data) / count, 2)
    _three_fout_per_week = round(sum(data.three_fout_per_week for data in filtered_data) / count, 2)
    _everyday = round(sum(data.everyday for data in filtered_data) / count, 2)

    data_convert_dict = {
        "마시지않는다": _no_drinking,
        "마신다": _drinking,
        "월1회이하": _one_under_per_month,
        "월2~3회": _one_two_per_month,
        "주1~2회": _one_two_per_week,
        "주3~4회": _three_fout_per_week,
        "거의매일": _everyday
    }

    # 결과 반환
    _drinking_rate = 0
    _drinking_rate_temp = 0
    _temp_num = 0

    for Frequency in request.drinking:
        if Frequency == "마시지않는다":
            _drinking_rate += data_convert_dict[Frequency]
        else:
            _drinking_rate_temp += data_convert_dict[Frequency]
            _temp_num += 1

    if _temp_num >= 1:
        _drinking_rate = round(_drinking_rate + _drinking * _drinking_rate_temp / 100, 2)

    drinking_result = DrinkingDisplay(
        drinking_rate= _drinking_rate
    )
    return drinking_result
음주 통계 자료 처리를 위한 CRUD.
마시지 않는다는 그대로 더하고 나머지는 평균값을 내는게 특이점이다.
from sqlalchemy.orm.session import Session
from sqlalchemy import func, or_
from db.models import DbIncome
from routers.schemas import IncomeBase, IncomeDisplay

def income_ans(db: Session, request: IncomeBase):
    age_ranges = []

    dividing_value = 5

    # 19세 이하 처리
    if request.age_start <= 19:
        age_ranges.append("19세 이하")
        request.age_start = 20
    request.age_start = request.age_start - request.age_start % dividing_value

    # 84세 이상 처리
    if request.age_end >= 65:
        age_ranges.append("65세 이상")
        request.age_end = 64

    # 5세 단위로 범위 생성
    age_ranges.extend(
        [f"{i}~{i + 4}세" for i in range(request.age_start, request.age_end + 1, dividing_value)])

    # 필터링을 위한 조건 생성
    filter_condition = or_(*[DbIncome.age.like(f"{age_range}") for age_range in age_ranges])

    # 나이로 필터링하여 데이터 가져오기
    filtered_data = db.query(DbIncome).filter(filter_condition).all()

    _income_rate = 0

    count = len(filtered_data)

    income_columns_dict = {
        "1000만원 이상": "income_1000_over",
        "150~250만원": "income_150_250",
        "250~350만원": "income_250_350",
        "350~450만원": "income_350_450",
        "450~550만원": "income_450_550",
        "550~650만원": "income_550_650",
        "650~800만원": "income_650_800",
        "800~1000만원": "income_800_1000",
        "85만원 미만": "income_85_under",
        "85~150만원": "income_85_150"
    }

    # 소득 항목에 대응하는 칼럼 합 구하기
    for data in filtered_data:
        for income_column in request.income:
            column_name = income_columns_dict[income_column]
            column_value = getattr(data, column_name)
            _income_rate += column_value

    # 데이터의 갯수로 나누어 평균 구하기
    if count > 0:
        _income_rate /= count

    income_rate = IncomeDisplay(
        income_rate=_income_rate
    )
    return income_rate
DB에서 쿼리를 하는 과정에서 문제가 있어서 답이 안나오나보다 하고 머리를 싸메고 있었는데,
나이를 5단위로 리스트를 만드는 과정에 문제가 있었다. "20 ~ 24세" 가 아니라 "20~24세" 띄어쓰기가 문제였다.
두시간 넘게 삽질했는데 허무한 원인이었다.
이로서 육각남 찾기 백엔드는 끝났다. 이제 프론트엔드를 본격적으로 꾸며볼 차례이다.
사실 로그인 기능, 덧글 등을 구현할까 했는데 좀 지쳐버렸다.
'파이썬 > 육각남 찾기 프로젝트(FastAPI+React)' 카테고리의 다른 글
| 육각남 찾기 프로젝트 19. 나머지 통계 자료 구현 두번째 (0) | 2024.03.29 |
|---|---|
| 육각남 찾기 프로젝트 18. 나머지 통계 자료 구현 첫번째 (0) | 2024.03.29 |
| 육각남 찾기 프로젝트 17. 백엔드 DB 데이터를 웹브라우져 그래프로 나타내기 (0) | 2024.03.27 |
| 육각남 찾기 프로젝트 15. 다시 백엔드 구체화하기 (0) | 2024.03.19 |
| 육각남 찾기 프로젝트 14. 나머지 입력 박스 추가하기 (0) | 2024.03.18 |
| 육각남 찾기 프로젝트 12. 챗 GPT로 프론트앤드 UI 꾸미기 (0) | 2024.03.17 |
| 육각남 찾기 프로젝트 11. React 헬로 월드 (0) | 2024.03.16 |
| 육각남 찾기 프로젝트 10. 첫번째 질문에 답하기 (0) | 2024.03.15 |